Datei:LogisticMap BifurcationDiagram.png
Größe dieser Vorschau: 800 × 566 Pixel. Weitere Auflösungen: 320 × 226 Pixel | 640 × 453 Pixel | 1.024 × 724 Pixel | 1.280 × 905 Pixel | 1.838 × 1.300 Pixel.
Originaldatei (1.838 × 1.300 Pixel, Dateigröße: 571 KB, MIME-Typ: image/png)
Beschreibung
| Beschreibung |
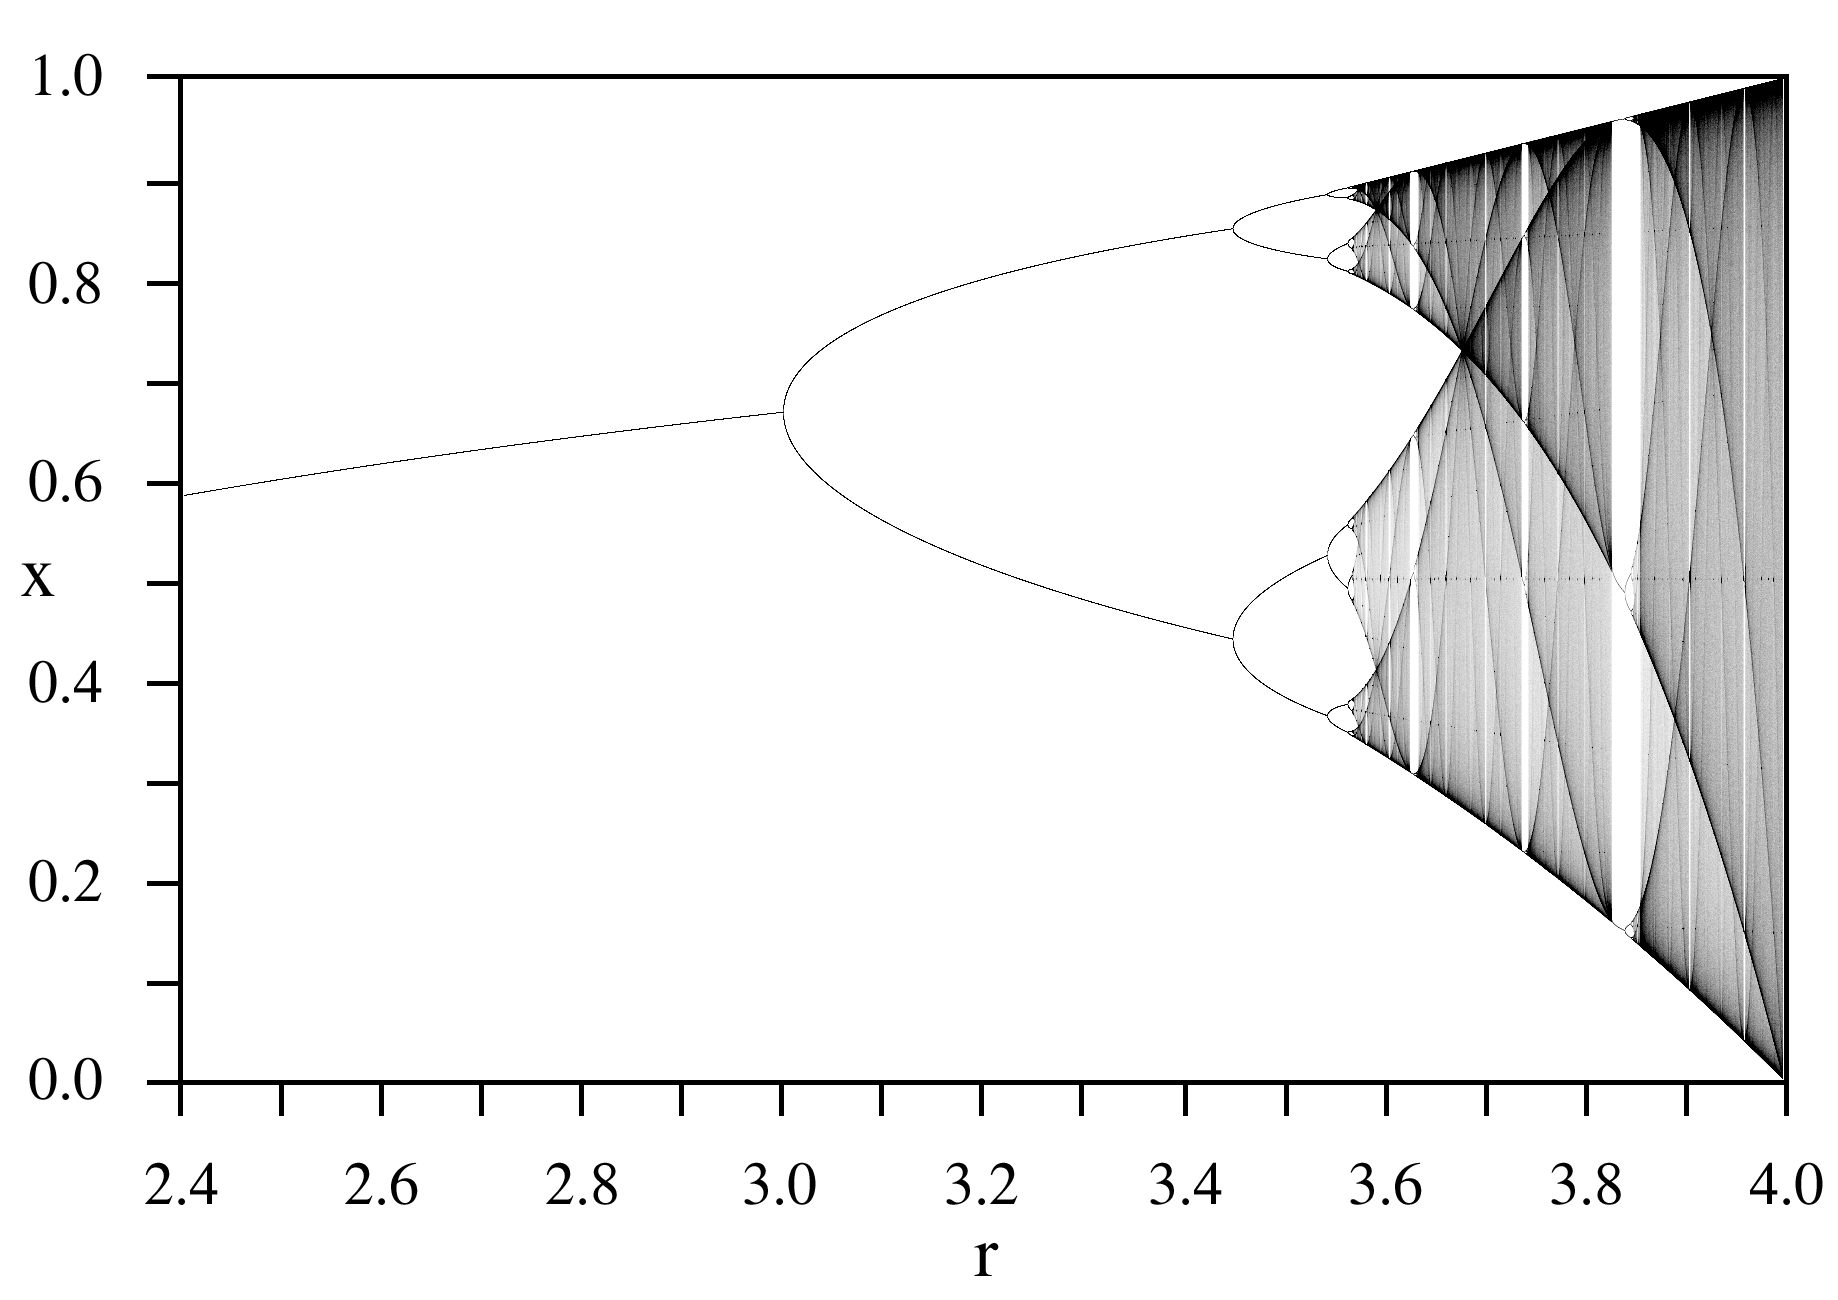
English: A bifurcation diagram for the Logistic map:
|
| Datum | |
| Quelle | Eigenes Werk |
| Urheber | PAR |

Lizenz
| Ich, der Urheberrechtsinhaber dieses Werkes, veröffentliche es als gemeinfrei. Dies gilt weltweit. In manchen Staaten könnte dies rechtlich nicht möglich sein. Sofern dies der Fall ist: Ich gewähre jedem das bedingungslose Recht, dieses Werk für jedweden Zweck zu nutzen, es sei denn, Bedingungen sind gesetzlich erforderlich. |

|
Dieses Bild sollte als Vektorgrafik im SVG-Format neu erstellt werden. Vektorformate haben zahlreiche Vorteile; weitere Information unter Commons:Media for cleanup. Wenn dir eine SVG-Version dieses Bildes vorliegt, so lade diese bitte hoch. Nach dem Hochladen der Datei ist diese Vorlage auf der aktuellen Bildbeschreibungsseite durch die Vorlage {{Vector version available}}, oder kürzer {{Vva}}, zu ersetzen. Es ist empfohlen die neue SVG-Datei „LogisticMap BifurcationDiagram.svg“ zu nennen – dann benötigt die Vorlage vector version available (bzw. vva) keinen Parameter.
|
Dateiversionen
Klicke auf einen Zeitpunkt, um diese Version zu laden.
| Version vom | Vorschaubild | Maße | Benutzer | Kommentar | |
|---|---|---|---|---|---|
| aktuell | 00:11, 14. Sep. 2005 | | 1.838 × 1.300 (571 KB) | wikimediacommons>PAR~commonswiki | Bifurcation diagram for the logistic map for parameter r=2.4 to 4.0. |
Dateiverwendung
Die folgenden 4 Seiten verwenden diese Datei: