Datei:A0V-blackbody SPD comparison.png
Größe dieser Vorschau: 800 × 492 Pixel. Weitere Auflösungen: 320 × 197 Pixel | 640 × 394 Pixel | 1.024 × 630 Pixel | 1.280 × 788 Pixel | 2.500 × 1.539 Pixel.
Originaldatei (2.500 × 1.539 Pixel, Dateigröße: 62 KB, MIME-Typ: image/png)
Beschreibung
| Beschreibung |
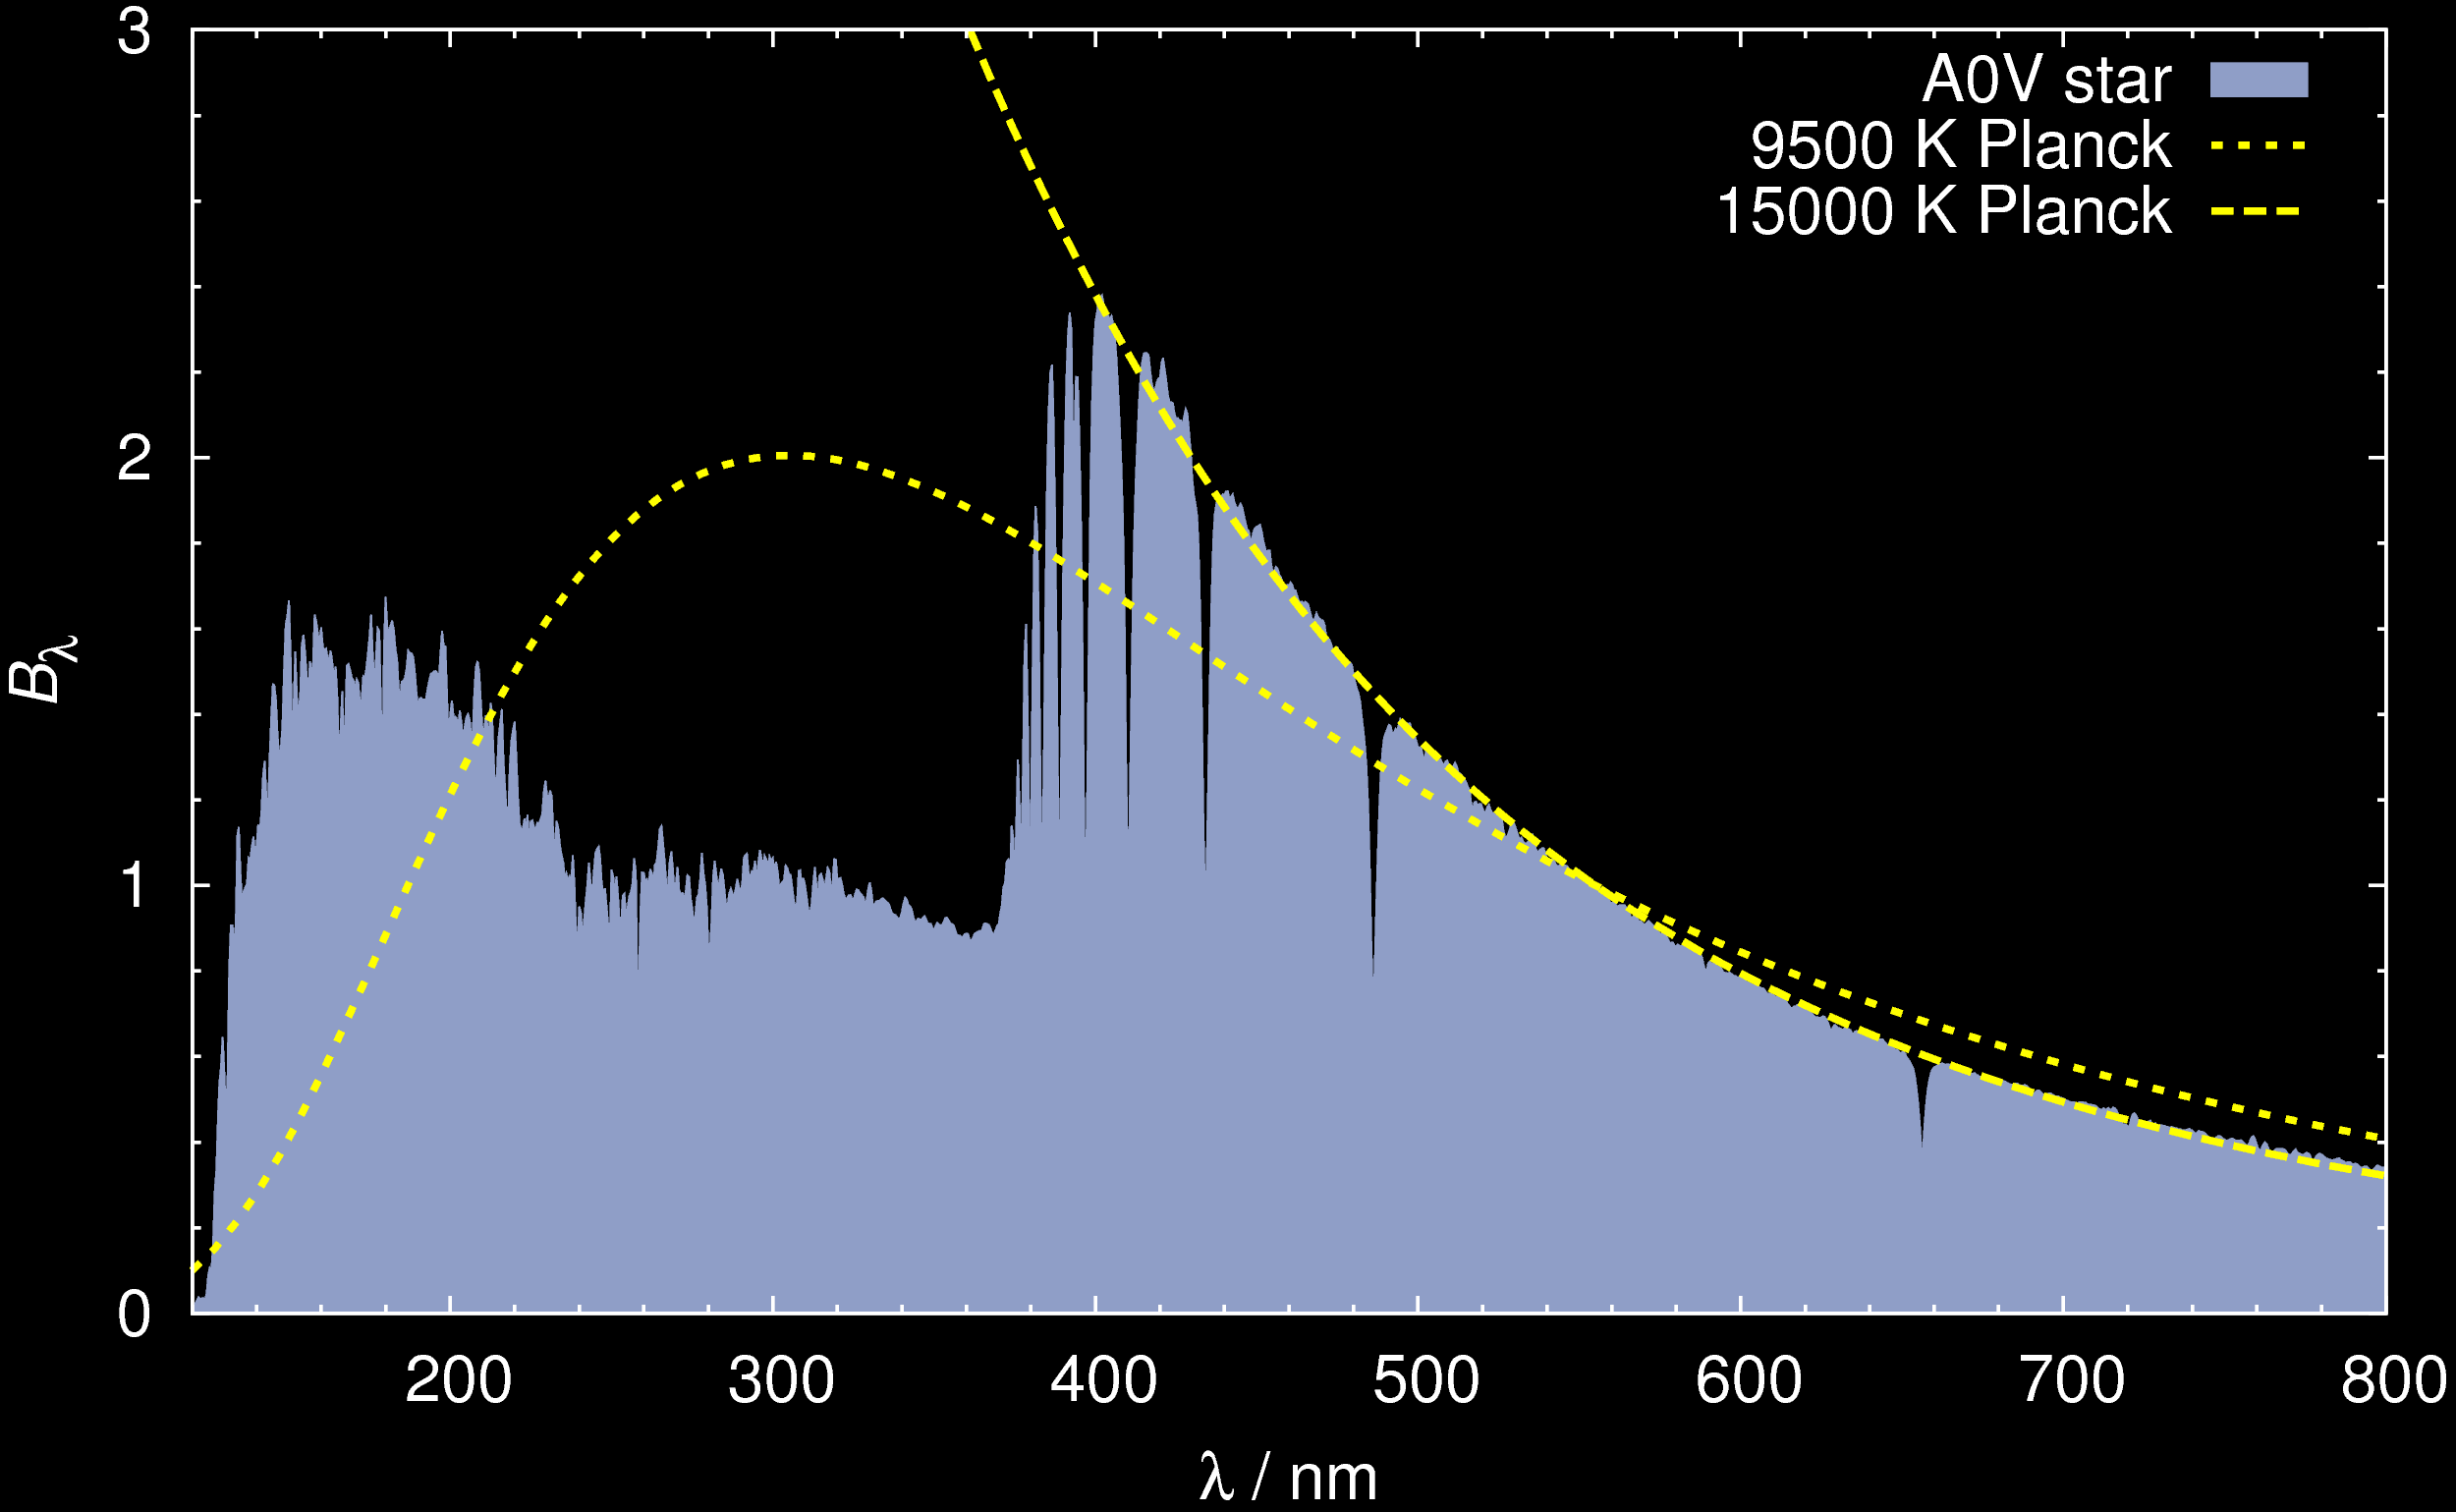
English: The spectral power distribution of a typical A0V star (like e.g. Vega) from the HILIB stellar spectra library in comparison with a Planckian blackbody spectrum of the same effective temperature of 9500 K (dotted line) and visual color temperature of 15000 K (dashed line). Intensity B is in arbitrary units, and the curves are normalised to match at lambda = 555 nm. Both temperatures differ mainly due to the Balmer absoption bands in the ultraviolet region. This image has been inspired by figure 6.7 in the book "Der neue Kosmos" by A. Unsöld and B. Baschek, Springer Berlin, Heidelberg, New York, 6th edition 1999. ISBN 3-540-64165-3. Created with gnuplot. |
| Datum | |
| Quelle | Eigenes Werk |
| Urheber | SiriusB |
Lizenz
Ich, der Urheber dieses Werkes, veröffentliche es unter der folgenden Lizenz:
Diese Datei ist unter der Creative-Commons-Lizenz „Namensnennung 3.0 nicht portiert“ lizenziert.
- Dieses Werk darf von dir
- verbreitet werden – vervielfältigt, verbreitet und öffentlich zugänglich gemacht werden
- neu zusammengestellt werden – abgewandelt und bearbeitet werden
- Zu den folgenden Bedingungen:
- Namensnennung – Du musst angemessene Urheber- und Rechteangaben machen, einen Link zur Lizenz beifügen und angeben, ob Änderungen vorgenommen wurden. Diese Angaben dürfen in jeder angemessenen Art und Weise gemacht werden, allerdings nicht so, dass der Eindruck entsteht, der Lizenzgeber unterstütze gerade dich oder deine Nutzung besonders.
Dateiversionen
Klicke auf einen Zeitpunkt, um diese Version zu laden.
| Version vom | Vorschaubild | Maße | Benutzer | Kommentar | |
|---|---|---|---|---|---|
| aktuell | 17:22, 2. Dez. 2012 | | 2.500 × 1.539 (62 KB) | wikimediacommons>SiriusB | The x-axis tics were hidden by the solid fill below the stellar SPD. Also changed the order of the key labels to be more intuitive. |
Dateiverwendung
Die folgende Seite verwendet diese Datei: