Datei:QHO-coherentstate3-animation-color.gif
QHO-coherentstate3-animation-color.gif (300 × 200 Pixel, Dateigröße: 449 KB, MIME-Typ: image/gif, Endlosschleife, 150 Bilder, 7,5 s)
Diese Datei stammt aus Wikimedia Commons und kann von anderen Projekten verwendet werden. Die Beschreibung von deren Dateibeschreibungsseite wird unten angezeigt.
Beschreibung
| BeschreibungQHO-coherentstate3-animation-color.gif |
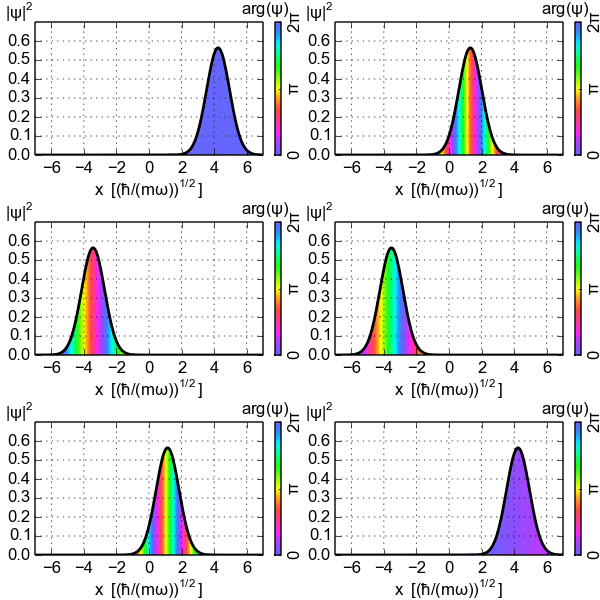
English: Animation of the quantum wave function of a coherent state of initial α=3 in a Quantum harmonic oscillator. The probability distribution is drawn along the ordinate, while the phase is encoded by color. The gaussian wave packet oscillates sinusoidally in the harmonic potential. |
| Datum | |
| Quelle |
Eigenes Werk Dieser Plot wurde mit Matplotlib erstellt. |
| Urheber | Geek3 |
| Andere Versionen | QHO-coherentstate3-animation.gif |
Source Code
The plot was generated with Matplotlib.
| Python Matplotlib source code |
|---|
#!/usr/bin/python
# -*- coding: utf8 -*-

from math import *
import matplotlib.pyplot as plt
from matplotlib import animation, colors, colorbar
import numpy as np
import colorsys
from scipy.interpolate import interp1d
import os, sys

plt.rc('path', snap=False)
plt.rc('mathtext', default='regular')

# image settings
fname = 'QHO-coherentstate3-animation-color'
width, height = 300, 200
ml, mr, mt, mb, mh, mc = 35, 19, 22, 45, 12, 6
x0, x1 = -7, 7
y0, y1 = 0.0, 0.7
nframes = 150
fps = 20

# physics settings
alpha0 = 3.0
omega = 2*pi

def color(phase):
    hue = (phase / (2*pi) + 2./3.) % 1
    light = interp1d([0, 1, 2, 3, 4, 5, 6], # adjust lightness
                     [0.64, 0.5, 0.55, 0.48, 0.70, 0.57, 0.64])(6 * hue)
    hls = (hue, light, 1.0) # maximum saturation
    rgb = colorsys.hls_to_rgb(*hls)
    return rgb

def coherent(alpha0, x, omega_t):
    # Definition of coherent states
    # https://en.wikipedia.org/wiki/Coherent_states
    alpha = alpha0 * e**(-1j * omega_t)
    psi = pi**-0.25 * np.exp(-0.5j * omega_t
                - 0.5 * ((x - sqrt(2) * alpha.real))**2
                - 1j * alpha.imag * (alpha.real - sqrt(2) * x))
    return psi

def animate(nframe):
    print str(nframe) + ' ',; sys.stdout.flush()
    t = float(nframe) / nframes # animation repeats after t=1.0

    ax.cla()
    ax.grid(True)
    ax.axis((x0, x1, y0, y1))

    x = np.linspace(x0, x1, int(ceil(1+w_px)))
    x2 = x - px_w/2.

    # Let's cheat a bit: add a phase phi(t)*const(x)
    # This will reduce the period from T=2*(2pi/omega) to T=1.0*(2pi/omega)
    # and allow fewer frames and less file size for repetition.
    # For big alpha the change is hardly visible
    psi = coherent(alpha0, x, omega * t) * np.exp(-0.5j * omega * t)
    psi2 = coherent(alpha0, x2, omega * t) * np.exp(-0.5j * omega * t)

    y = np.abs(psi)**2
    phi = np.angle(psi2)

    # plot color filling
    for x_, phi_, y_ in zip(x, phi, y):
        ax.plot([x_, x_], [0, y_], color=color(phi_), lw=2*0.72)

    ax.plot(x, y, lw=2, color='black')
    ax.set_yticklabels([l for l in ax.get_yticks() if l < y0+0.9*(y1-y0)])


# create figure and axes
plt.close('all')
fig, ax = plt.subplots(1, figsize=(width/100., height/100.))
bounds = [float(ml)/width, float(mb)/height,
          1.0 - float(mr+mc+mh)/width, 1.0 - float(mt)/height]
fig.subplots_adjust(left=bounds[0], bottom=bounds[1],
                    right=bounds[2], top=bounds[3], hspace=0)
w_px = width - (ml+mr+mh+mc) # plot width in pixels
px_w = float(x1 - x0) / w_px # width of one pixel in plot units

# axes labels
fig.text(0.5 + 0.5 * float(ml-mh-mc-mr)/width, 4./height,
         r'$x\ \ [(\hbar/(m\omega))^{1/2}]$', ha='center')
fig.text(5./width, 1.0, '$|\psi|^2$', va='top')

# colorbar for phase
cax = fig.add_axes([1.0 - float(mr+mc)/width, float(mb)/height,
                    float(mc)/width, 1.0 - float(mb+mt)/height])
cax.yaxis.set_tick_params(length=2)
cmap = colors.ListedColormap([color(phase) for phase in
                              np.linspace(0, 2*pi, 384, endpoint=False)])
norm = colors.Normalize(0, 2*pi)
cbar = colorbar.ColorbarBase(cax, cmap=cmap, norm=norm,
                    orientation='vertical', ticks=np.linspace(0, 2*pi, 3))
cax.set_yticklabels(['$0$', r'$\pi$', r'$2\pi$'], rotation=90)
fig.text(1.0 - 10./width, 1.0, '$arg(\psi)$', ha='right', va='top')
plt.sca(ax)

# start animation
if 0 != os.system('convert -version > ' +  os.devnull):
    print 'imagemagick not installed!'
    # warning: imagemagick produces somewhat jagged and therefore large gifs
    anim = animation.FuncAnimation(fig, animate, frames=nframes)
    anim.save(fname + '.gif', writer='imagemagick', fps=fps)
else:
    # unfortunately the matplotlib imagemagick backend does not support
    # options which are necessary to generate high quality output without
    # framewise color palettes. Therefore save all frames and convert then.
    if not os.path.isdir(fname):
        os.mkdir(fname)
    fnames = []

    for frame in range(nframes):
        animate(frame)
        imgname = os.path.join(fname, fname + '{:03d}'.format(frame) + '.png')
        fig.savefig(imgname)
        fnames.append(imgname)

    # compile optimized animation with ImageMagick
    cmd = 'convert -loop 0 -delay ' + str(100 / fps) + ' '
    cmd += ' '.join(fnames) # now create optimized palette from all frames
    cmd += r' \( -clone 0--1 \( -clone 0--1 -fill black -colorize 100% \) '
    cmd += '-append +dither -colors 255 -unique-colors '
    cmd += '-write mpr:colormap +delete \) +dither -map mpr:colormap '
    cmd += '-alpha activate -layers OptimizeTransparency '
    cmd += fname + '.gif'
    os.system(cmd)

    for fnamei in fnames:
        os.remove(fnamei)
    os.rmdir(fname)
|
Lizenz
Ich, der Urheberrechtsinhaber dieses Werkes, veröffentliche es hiermit unter der folgenden Lizenz:

|
Es ist erlaubt, die Datei unter den Bedingungen der GNU-Lizenz für freie Dokumentation, Version 1.2 oder einer späteren Version, veröffentlicht von der Free Software Foundation, zu kopieren, zu verbreiten und/oder zu modifizieren; es gibt keine unveränderlichen Abschnitte, keinen vorderen und keinen hinteren Umschlagtext.
Der vollständige Text der Lizenz ist im Kapitel GNU-Lizenz für freie Dokumentation verfügbar.http://www.gnu.org/copyleft/fdl.htmlGFDLGNU Free Documentation Licensetruetrue |
Diese Datei ist unter der Creative-Commons-Lizenz „Namensnennung 3.0 nicht portiert“ lizenziert.
- Dieses Werk darf von dir
- verbreitet werden – vervielfältigt, verbreitet und öffentlich zugänglich gemacht werden
- neu zusammengestellt werden – abgewandelt und bearbeitet werden
- Zu den folgenden Bedingungen:
- Namensnennung – Du musst angemessene Urheber- und Rechteangaben machen, einen Link zur Lizenz beifügen und angeben, ob Änderungen vorgenommen wurden. Diese Angaben dürfen in jeder angemessenen Art und Weise gemacht werden, allerdings nicht so, dass der Eindruck entsteht, der Lizenzgeber unterstütze gerade dich oder deine Nutzung besonders.
Du darfst es unter einer der obigen Lizenzen deiner Wahl verwenden.
Kurzbeschreibungen
Ergänze eine einzeilige Erklärung, was diese Datei darstellt.
In dieser Datei abgebildete Objekte
Motiv
Einige Werte ohne einen Wikidata-Eintrag
20. September 2015
Dateiversionen
Klicke auf einen Zeitpunkt, um diese Version zu laden.
| Version vom | Vorschaubild | Maße | Benutzer | Kommentar | |
|---|---|---|---|---|---|
| aktuell | 21:42, 10. Okt. 2015 |  | 300 × 200 (449 KB) | wikimediacommons>Geek3 | better compression |
Dateiverwendung
Die folgende Seite verwendet diese Datei:
